Fits exponential beta curves to 13C breath test series data using Bayesian Stan methods. See https://menne-biomed.de/blog/breath-test-stan/ for a comparison between single curve, mixed-model population and Bayesian methods.
Usage
stan_fit(
  data,
  dose = 100,
  sample_minutes = 15,
  student_t_df = 10,
  chains = 2,
  iter = 1000,
  seed = 4711
)
Arguments
- data
Data frame or tibble as created by
cleanup_data, with mandatory columnspatient_id, group, minuteandpdr. It is recommended to run all data throughcleanup_datawhich will insert dummy columns forpatient_idandminuteif the data are distinct, and report an error if not. It is possible to fit single curves, but this does not make fully use of the stabilization of the estimated t50. Instead of fitting single curves, use a set of 20+ of the typical data in your clinic, and append the data set from the single patient as a mix-in.- dose
Dose of acetate or octanoate. Currently, only one common dose for all records is supported.
- sample_minutes
If mean sampling interval is < sampleMinutes, data are subsampled using a spline algorithm
- student_t_df
When student_t_df < 10, the student distribution is used to model the residuals. Recommended values to model typical outliers are from 3 to 6. When student_t_df >= 10, the normal distribution is used.
- chains
Number of chains for Stan
- iter
Number of iterations for each Stan chain
- seed
Optional seed for rstan
Value
A list of classes "breathteststanfit" and "breathtestfit" with elements
coefEstimated parameters as data frame in a key-value format with columnspatient_id, group, parameter, methodandvalue. Has an attribute AIC.dataThe effectively analyzed data. If density of points is too high, e.g. with BreathId devices, data are subsampled before fitting.stan_fitThe Stan fit for use withshinystan::launch_shinyor extraction of chains.
Examples
# This needs some time !!!
library(breathtestcore)
cmdstanr::check_cmdstan_toolchain(fix = TRUE, quiet = TRUE)
#> Warning: The 'fix' argument is deprecated as of CmdStanR 1.0.0 and will be removed in a future release.
library(dplyr, quietly = TRUE, warn.conflicts = FALSE)
d = simulate_breathtest_data(n_records = 3) # default 3 records
data = cleanup_data(d$data)
# Use more than 80 iterations and 4 chains for serious fits
fit = stan_fit(data, chains = 1, iter = 80)
plot(fit) # calls plot.breathtestfit
 # Extract coefficients and compare these with those
# used to generate the data
options(digits = 2)
cf = coef(fit)
cf |>
filter(grepl("m|k|beta", parameter)) |>
select(-method, -group) |>
tidyr::spread(parameter, value) |>
inner_join(d$record, by = "patient_id") |>
select(
patient_id,
m_in = m.y,
m_out = m.x,
beta_in = beta.y,
beta_out = beta.x,
k_in = k.y,
k_out = k.x
)
#> # A tibble: 3 × 7
#> patient_id m_in m_out beta_in beta_out k_in k_out
#> <chr> <dbl> <dbl> <dbl> <dbl> <dbl> <dbl>
#> 1 rec_01 26 23.6 1.27 1.34 0.00999 0.0115
#> 2 rec_02 43 42.6 1.90 1.91 0.0116 0.0118
#> 3 rec_03 16 16.6 1.90 1.79 0.0129 0.0118
# For a detailed analysis of the fit, use the shinystan library
# shinystan::launch_shinystan(fit$stan_fit)
# \donttest{
# The following plots are somewhat degenerate because
# of the few iterations in stan_fit
library(bayesplot)
#> This is bayesplot version 1.15.0
#> - Online documentation and vignettes at mc-stan.org/bayesplot
#> - bayesplot theme set to bayesplot::theme_default()
#> * Does _not_ affect other ggplot2 plots
#> * See ?bayesplot_theme_set for details on theme setting
color_scheme_set("viridisD")
drws = fit$stan_fit$draws(variables = c("beta[1]", "beta[2]", "beta[3]"))
mcmc_dens(drws)
# Extract coefficients and compare these with those
# used to generate the data
options(digits = 2)
cf = coef(fit)
cf |>
filter(grepl("m|k|beta", parameter)) |>
select(-method, -group) |>
tidyr::spread(parameter, value) |>
inner_join(d$record, by = "patient_id") |>
select(
patient_id,
m_in = m.y,
m_out = m.x,
beta_in = beta.y,
beta_out = beta.x,
k_in = k.y,
k_out = k.x
)
#> # A tibble: 3 × 7
#> patient_id m_in m_out beta_in beta_out k_in k_out
#> <chr> <dbl> <dbl> <dbl> <dbl> <dbl> <dbl>
#> 1 rec_01 26 23.6 1.27 1.34 0.00999 0.0115
#> 2 rec_02 43 42.6 1.90 1.91 0.0116 0.0118
#> 3 rec_03 16 16.6 1.90 1.79 0.0129 0.0118
# For a detailed analysis of the fit, use the shinystan library
# shinystan::launch_shinystan(fit$stan_fit)
# \donttest{
# The following plots are somewhat degenerate because
# of the few iterations in stan_fit
library(bayesplot)
#> This is bayesplot version 1.15.0
#> - Online documentation and vignettes at mc-stan.org/bayesplot
#> - bayesplot theme set to bayesplot::theme_default()
#> * Does _not_ affect other ggplot2 plots
#> * See ?bayesplot_theme_set for details on theme setting
color_scheme_set("viridisD")
drws = fit$stan_fit$draws(variables = c("beta[1]", "beta[2]", "beta[3]"))
mcmc_dens(drws)
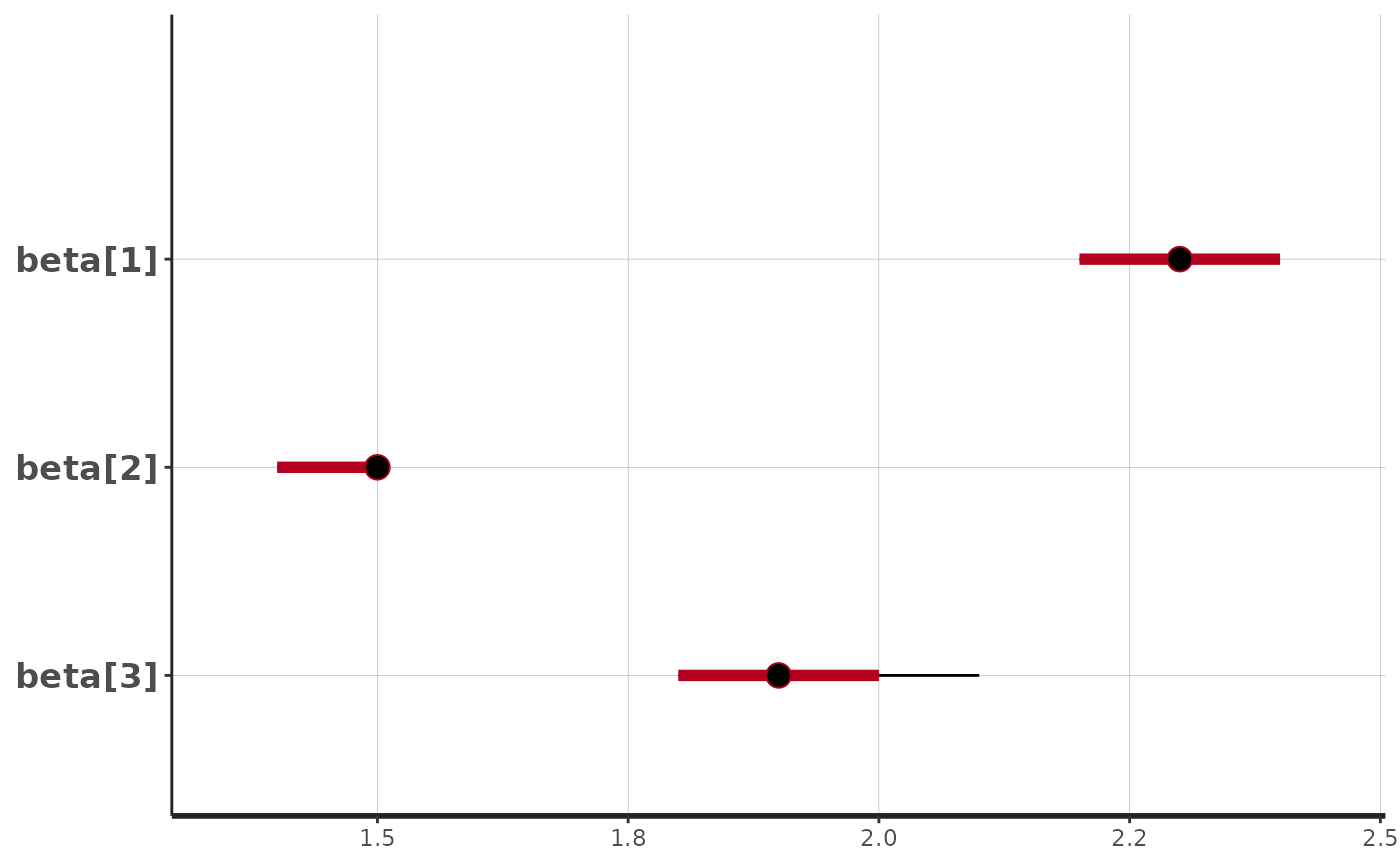 mcmc_hist(fit$stan_fit$draws(variables = c("beta[1]", "beta[2]", "beta[3]")))
#> `stat_bin()` using `bins = 30`. Pick better value `binwidth`.
mcmc_hist(fit$stan_fit$draws(variables = c("beta[1]", "beta[2]", "beta[3]")))
#> `stat_bin()` using `bins = 30`. Pick better value `binwidth`.
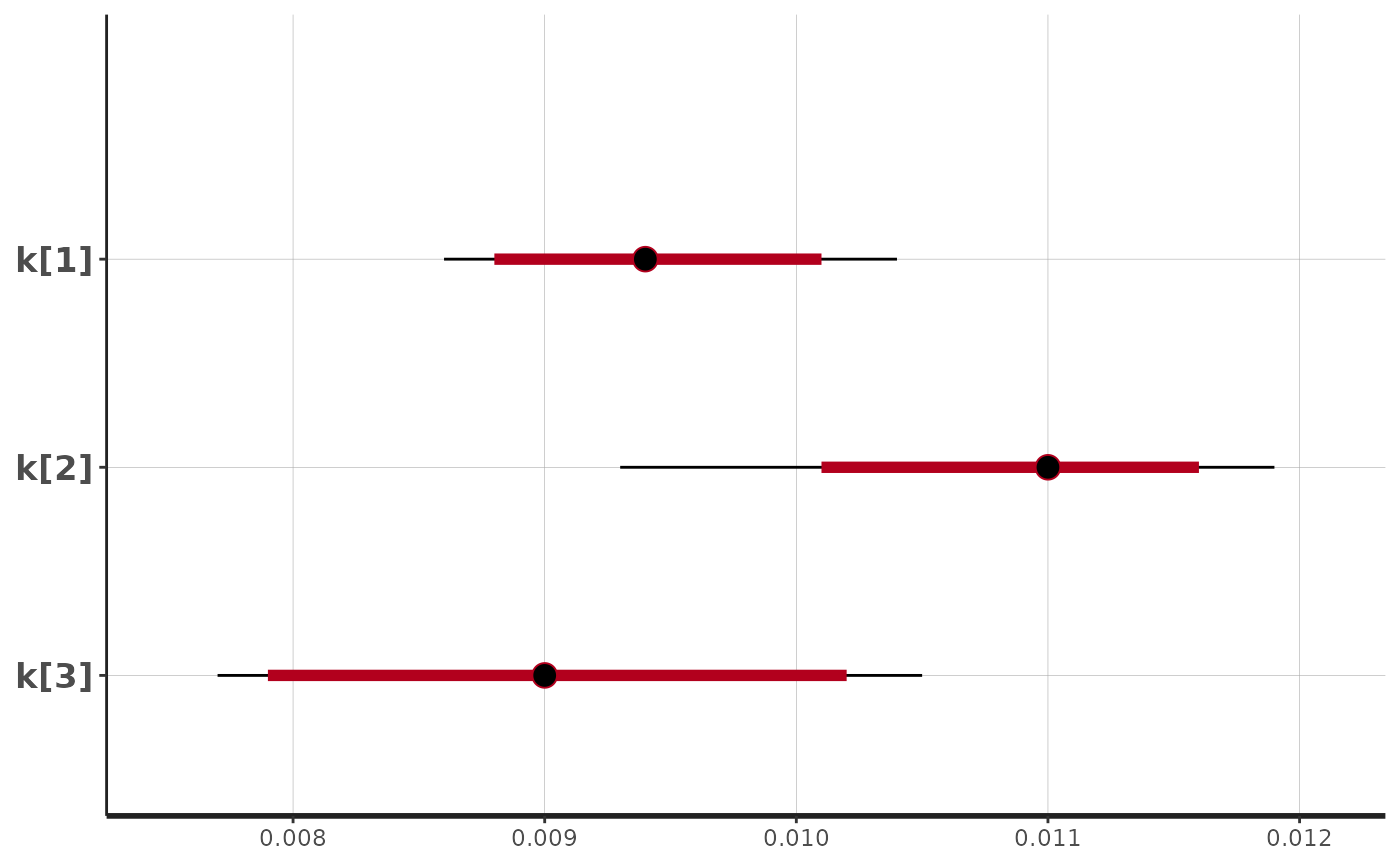 mcmc_intervals(fit$stan_fit$draws(variables = c("beta[1]", "beta[2]", "beta[3]")))
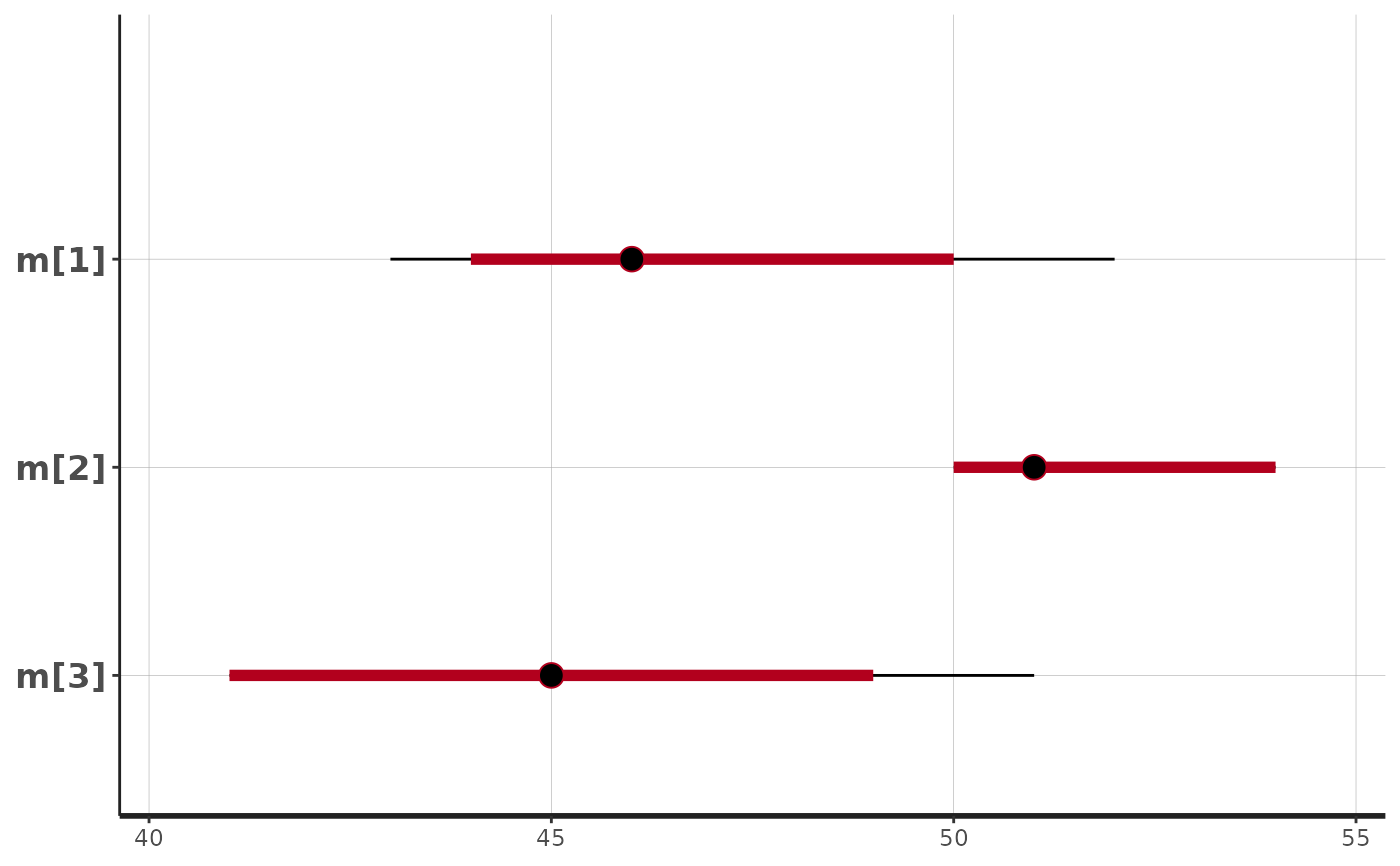 mcmc_trace(fit$stan_fit$draws(variables = c("beta[1]", "beta[2]", "beta[3]")))
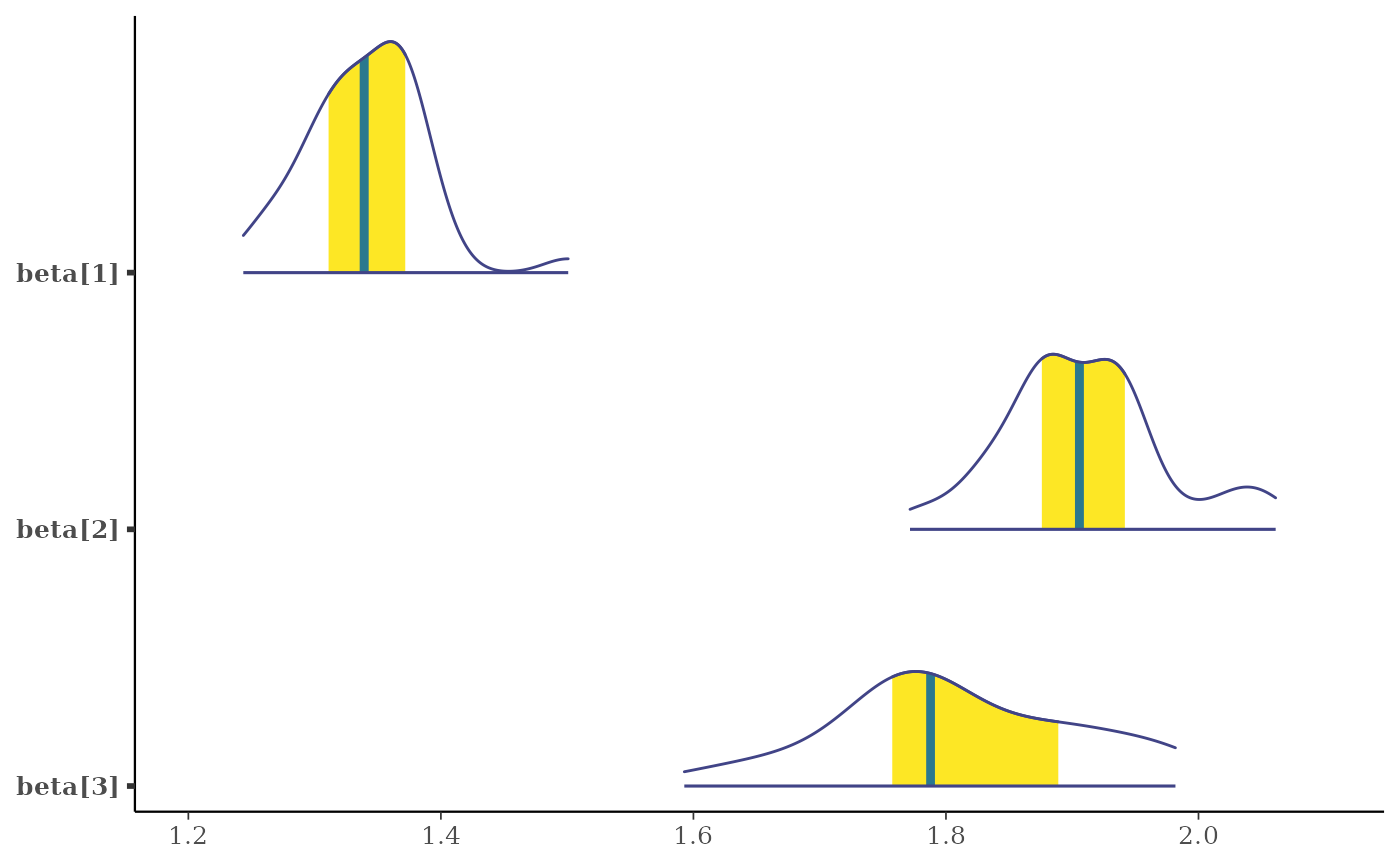
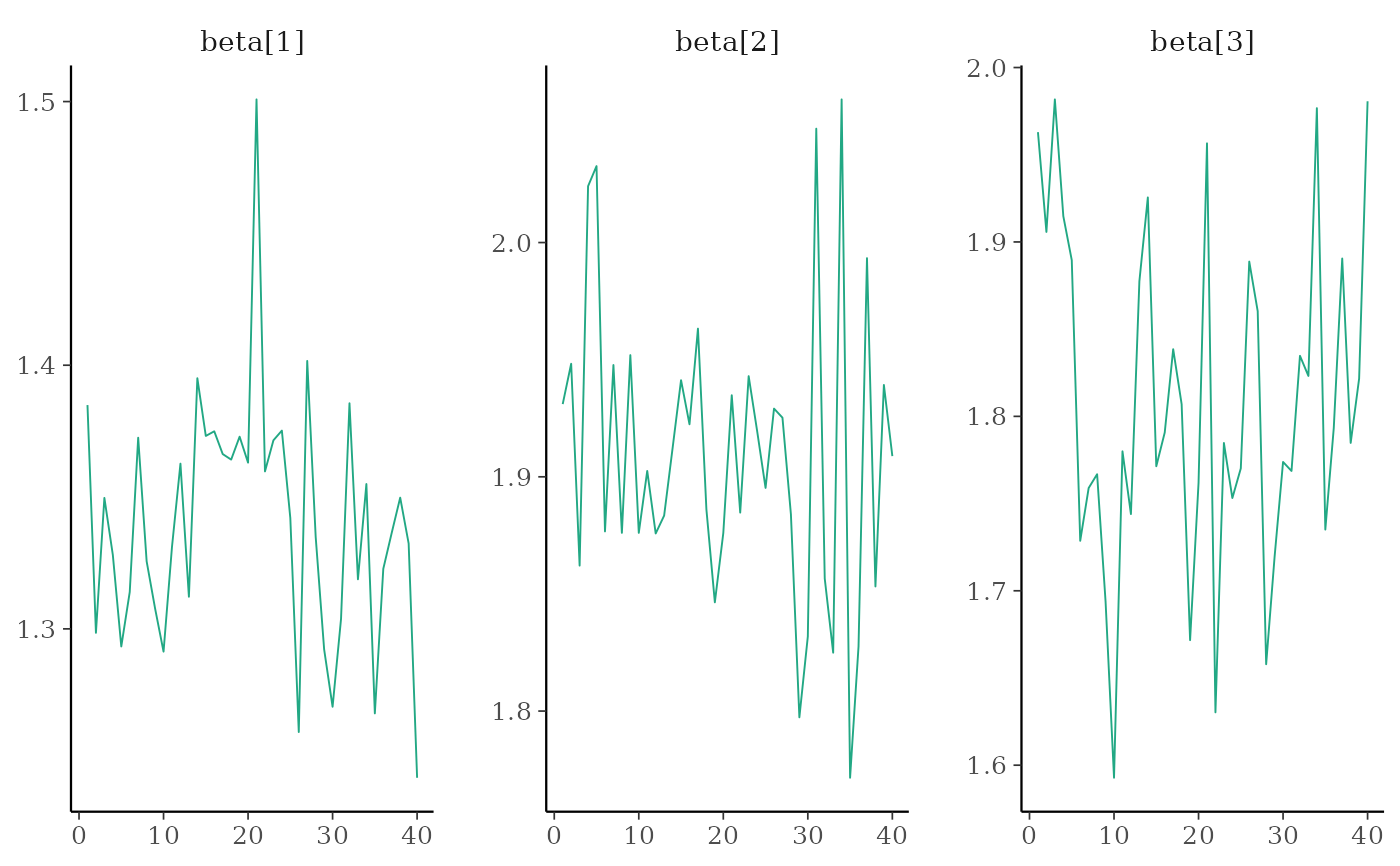 mcmc_areas(fit$stan_fit$draws(variables = c("beta[1]", "beta[2]", "beta[3]")))
 # }
# }