The linexp and the power exponential (powexp) functions can
be used to fit gastric emptying curves.
Usage
linexp(t, v0 = 1, tempt = NULL, kappa = NULL, pars = NULL)

linexp_slope(t, v0 = 1, tempt = NULL, kappa = NULL, pars = NULL)

linexp_auc(v0 = 1, tempt = NULL, kappa = NULL, pars = NULL)

powexp(t, v0 = 1, tempt = NULL, beta = NULL, pars = NULL)

powexp_slope(t, v0 = 1, tempt = NULL, beta = NULL, pars = NULL)

linexp_log(t, v0 = 1, logtempt = NULL, logkappa = NULL, pars = NULL)

powexp_log(t, v0 = 1, logtempt = NULL, logbeta = NULL, pars = NULL)
Arguments
- t
Time after meal or start of scan, in minutes; can be a vector.
- v0
Initial volume at t=0.
- tempt
Emptying time constant in minutes (scalar).
- kappa
Overshoot term for linexp function (scalar).
- pars
Default NULL. If not NULL, the other parameters with exception of
tare not used and are retrieved as named parameters from the numeric vector pars instead.- beta
Power term for power exponential function (scalar).
- logtempt
Logarithm of emptying time constant in minutes (scalar).
- logkappa
Logarithm of overshoot term for linexp function (scalar).
- logbeta
Logarithm of power term for power exponential function (scalar).
Details
The linexp function can have an initial overshoot
to model secretion.
vol(t) = v0 * (1 + kappa * t / tempt) * exp(-t / tempt)
The powexp function introduced by Elashof et al. is
montonously decreasing but has more freedom to model details in the
function tail.
vol(t) = v0 * exp(-(t / tempt) ^ beta)
The _slope functions return the first derivatives of linexp
and powexp.
Use the _log functions to enforce positive parameters
tempt and beta. Rarely required for gastric emptying curves.
Examples
t = seq(0,100, by=5)
kappa = 1.3
tempt = 60
v0 = 400
beta = 3
pars = c(v0 = v0, tempt = tempt, kappa = kappa)
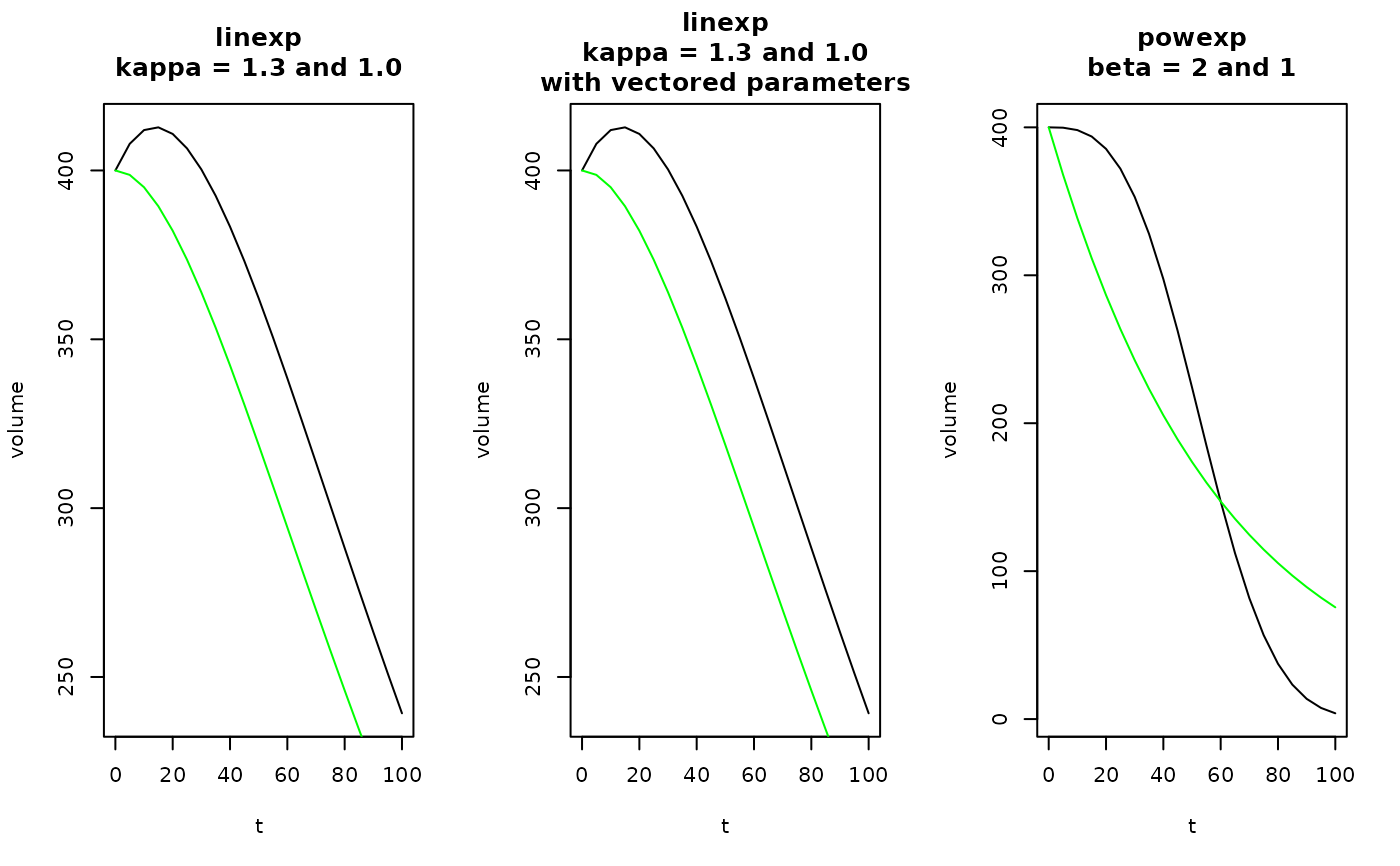
oldpar = par(mfrow = c(1,3))
plot(t, linexp(t, v0, tempt, kappa), type = "l", ylab = "volume",
main = "linexp\nkappa = 1.3 and 1.0")
lines(t, linexp(t, v0, tempt, 1), type = "l", col = "green")
# This should give the same plot as above
plot(t, linexp(t, pars = pars), type = "l", ylab = "volume",
main = "linexp\nkappa = 1.3 and 1.0\nwith vectored parameters")
lines(t, linexp(t, v0, tempt, 1), type = "l", col = "green")
plot(t, powexp(t, v0, tempt, beta), type = "l", ylab = "volume",
main = "powexp\nbeta = 2 and 1")
lines(t, powexp(t, v0, tempt, 1), type = "l", col = "green")
 par(oldpar)