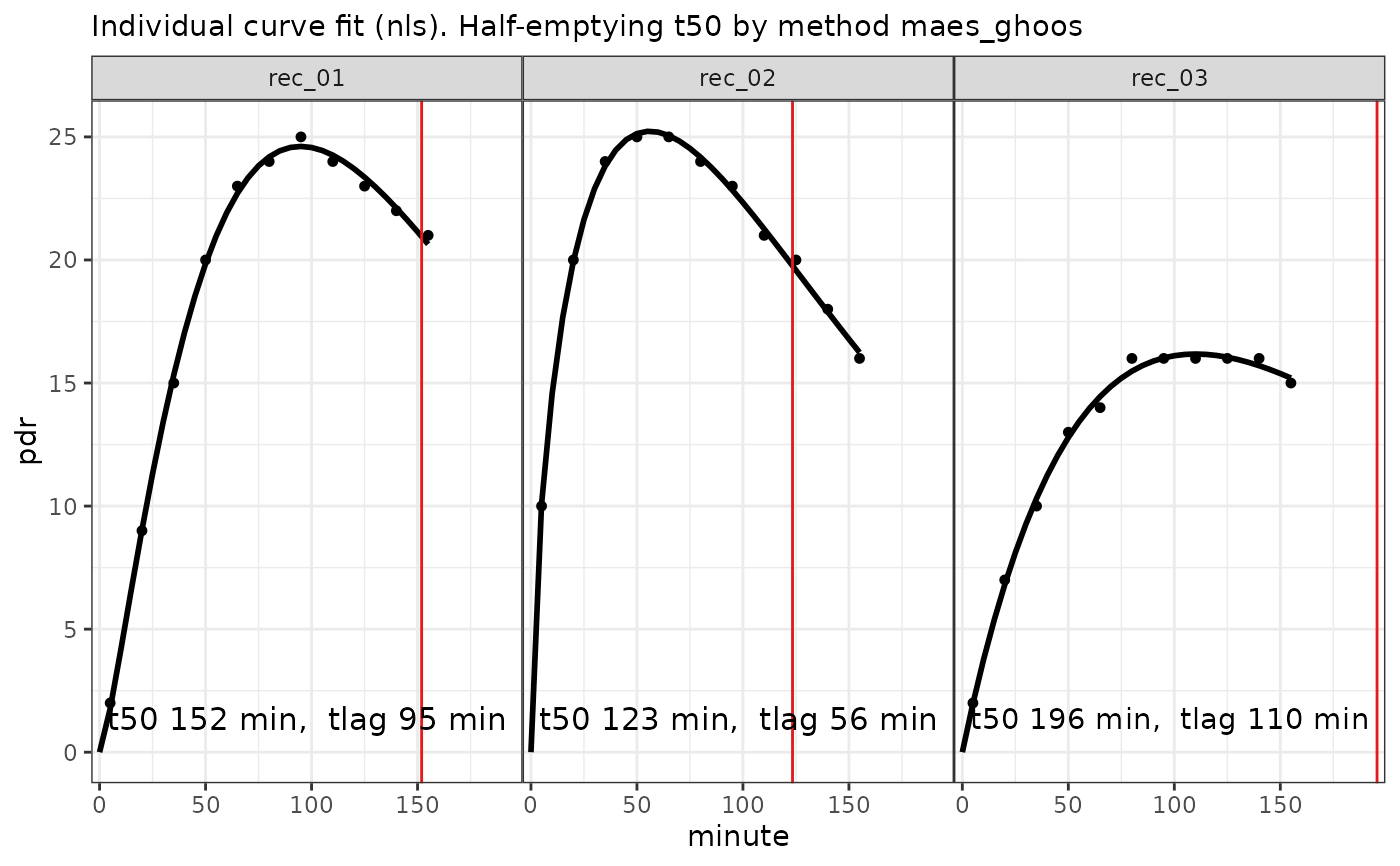
Fits individual exponential beta curves to 13C breath test time series
Usage
nls_fit(data, dose = 100, start = list(m = 50, k = 1/100, beta = 2))Arguments
- data
Data frame or tibble as created by
cleanup_data, with mandatory columnspatient_id, group, minuteandpdr. It is recommended to run all data throughcleanup_datawhich will insert dummy columns forpatient_idandminuteif the data are distinct, and report an error if not.- dose
Dose of acetate or octanoate. Currently, only one common dose for all records is supported.
- start
Optional start values
patient_idandgroup.
Value
A list of class ("breathtestnlsfit" "breathtestfit") with elements
- coef
Estimated parameters in a key-value format with columns
patient_id, group, parameter, stat, methodandvalue. Parameterstatalways has value"estimate". Confidence intervals might be added later, so do not take for granted all parameters are estimates.- data
Input data;
nls_fitdoes not decimate the data. If you have large data sets where subsampling might be required to achieve faster convergence, usingnls_fitanyway is only relevant to show how NOT to do it. Usenlme_fitorstan_fitinstead.
Examples
d = simulate_breathtest_data(n_records = 3, noise = 0.2, seed = 4711)
data = cleanup_data(d$data)
fit = nls_fit(data)
plot(fit) # calls plot.breathtestfit

options(digits = 2)
cf = coef(fit)
library(dplyr)
cf %>%
  filter(grepl("m|k|beta", parameter )) %>%
  select(-method, -group) %>%
  tidyr::spread(parameter, value) %>%
  inner_join(d$record, by = "patient_id") %>%
  select(patient_id, m_in = m.y, m_out = m.x,
         beta_in = beta.y, beta_out = beta.x,
         k_in = k.y, k_out = k.x)
#> # A tibble: 3 × 7
#>   patient_id  m_in m_out beta_in beta_out    k_in   k_out
#>   <chr>      <dbl> <dbl>   <dbl>    <dbl>   <dbl>   <dbl>
#> 1 rec_01        58  58.0    2.33     2.34 0.00898 0.00895
#> 2 rec_02        54  53.6    1.61     1.61 0.00847 0.00852
#> 3 rec_03        52  51.6    1.98     1.99 0.00623 0.00626
options(digits = 2)
cf = coef(fit)
library(dplyr)
cf %>%
filter(grepl("m|k|beta", parameter )) %>%
select(-method, -group) %>%
tidyr::spread(parameter, value) %>%
inner_join(d$record, by = "patient_id") %>%
select(patient_id, m_in = m.y, m_out = m.x,
beta_in = beta.y, beta_out = beta.x,
k_in = k.y, k_out = k.x)
#> # A tibble: 3 × 7
#> patient_id m_in m_out beta_in beta_out k_in k_out
#> <chr> <dbl> <dbl> <dbl> <dbl> <dbl> <dbl>
#> 1 rec_01 58 58.0 2.33 2.34 0.00898 0.00895
#> 2 rec_02 54 53.6 1.61 1.61 0.00847 0.00852
#> 3 rec_03 52 51.6 1.98 1.99 0.00623 0.00626